-
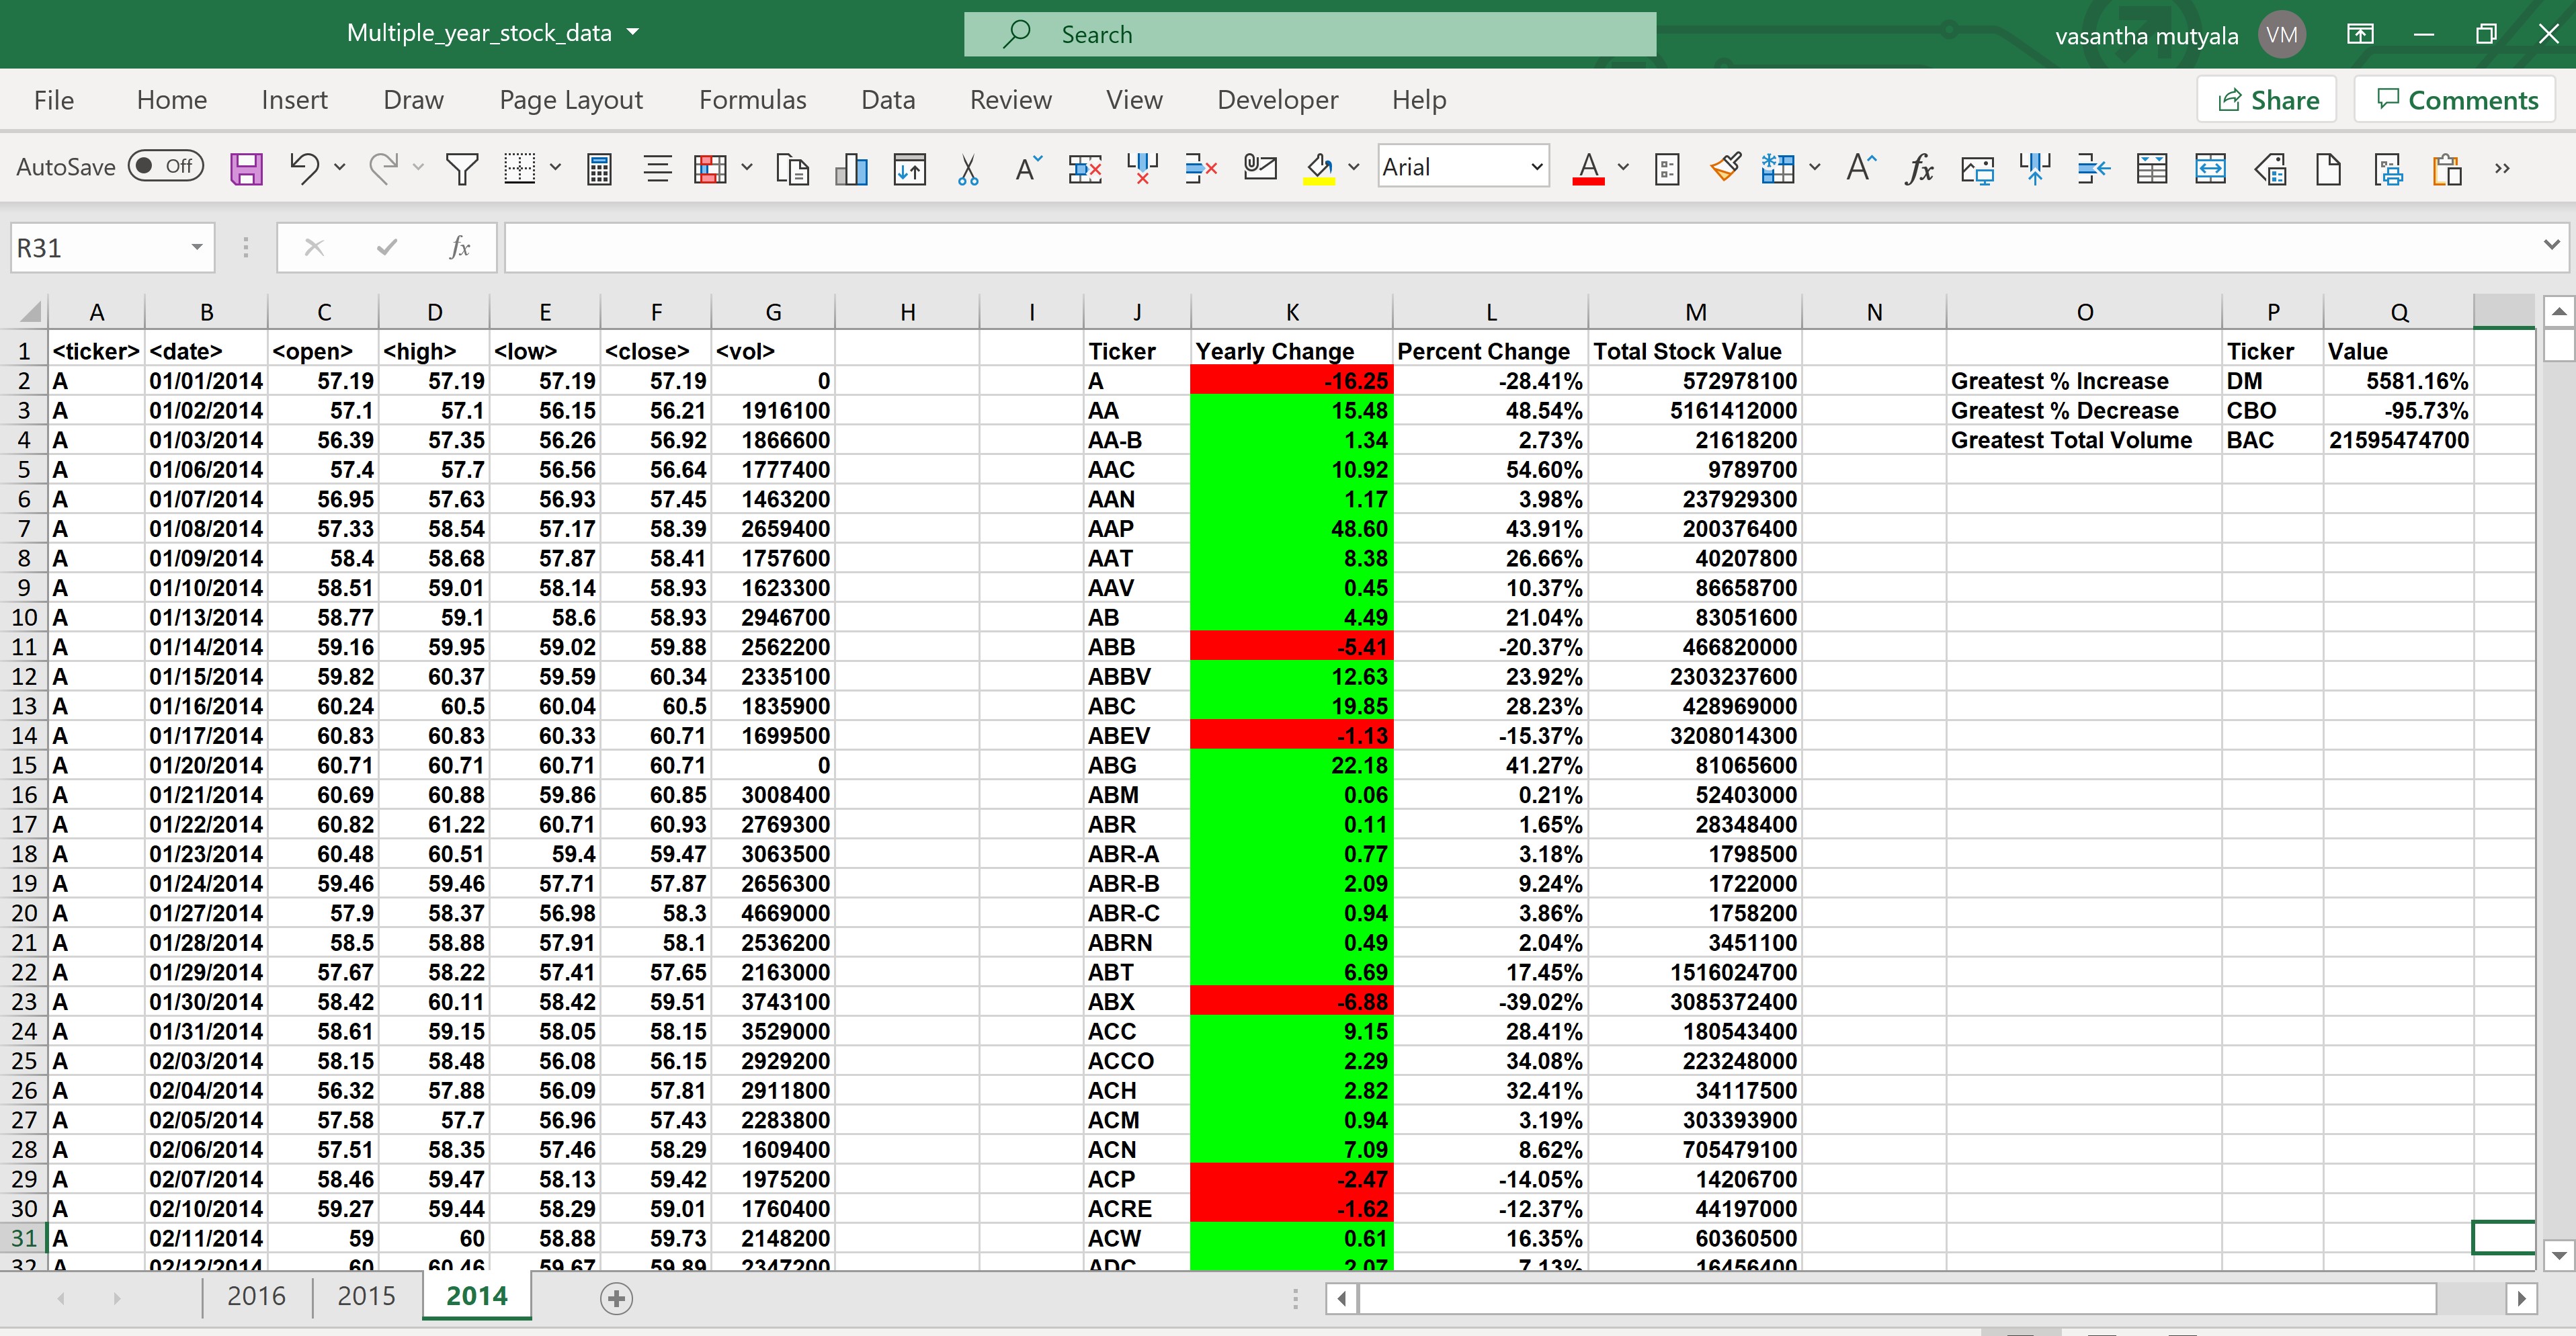
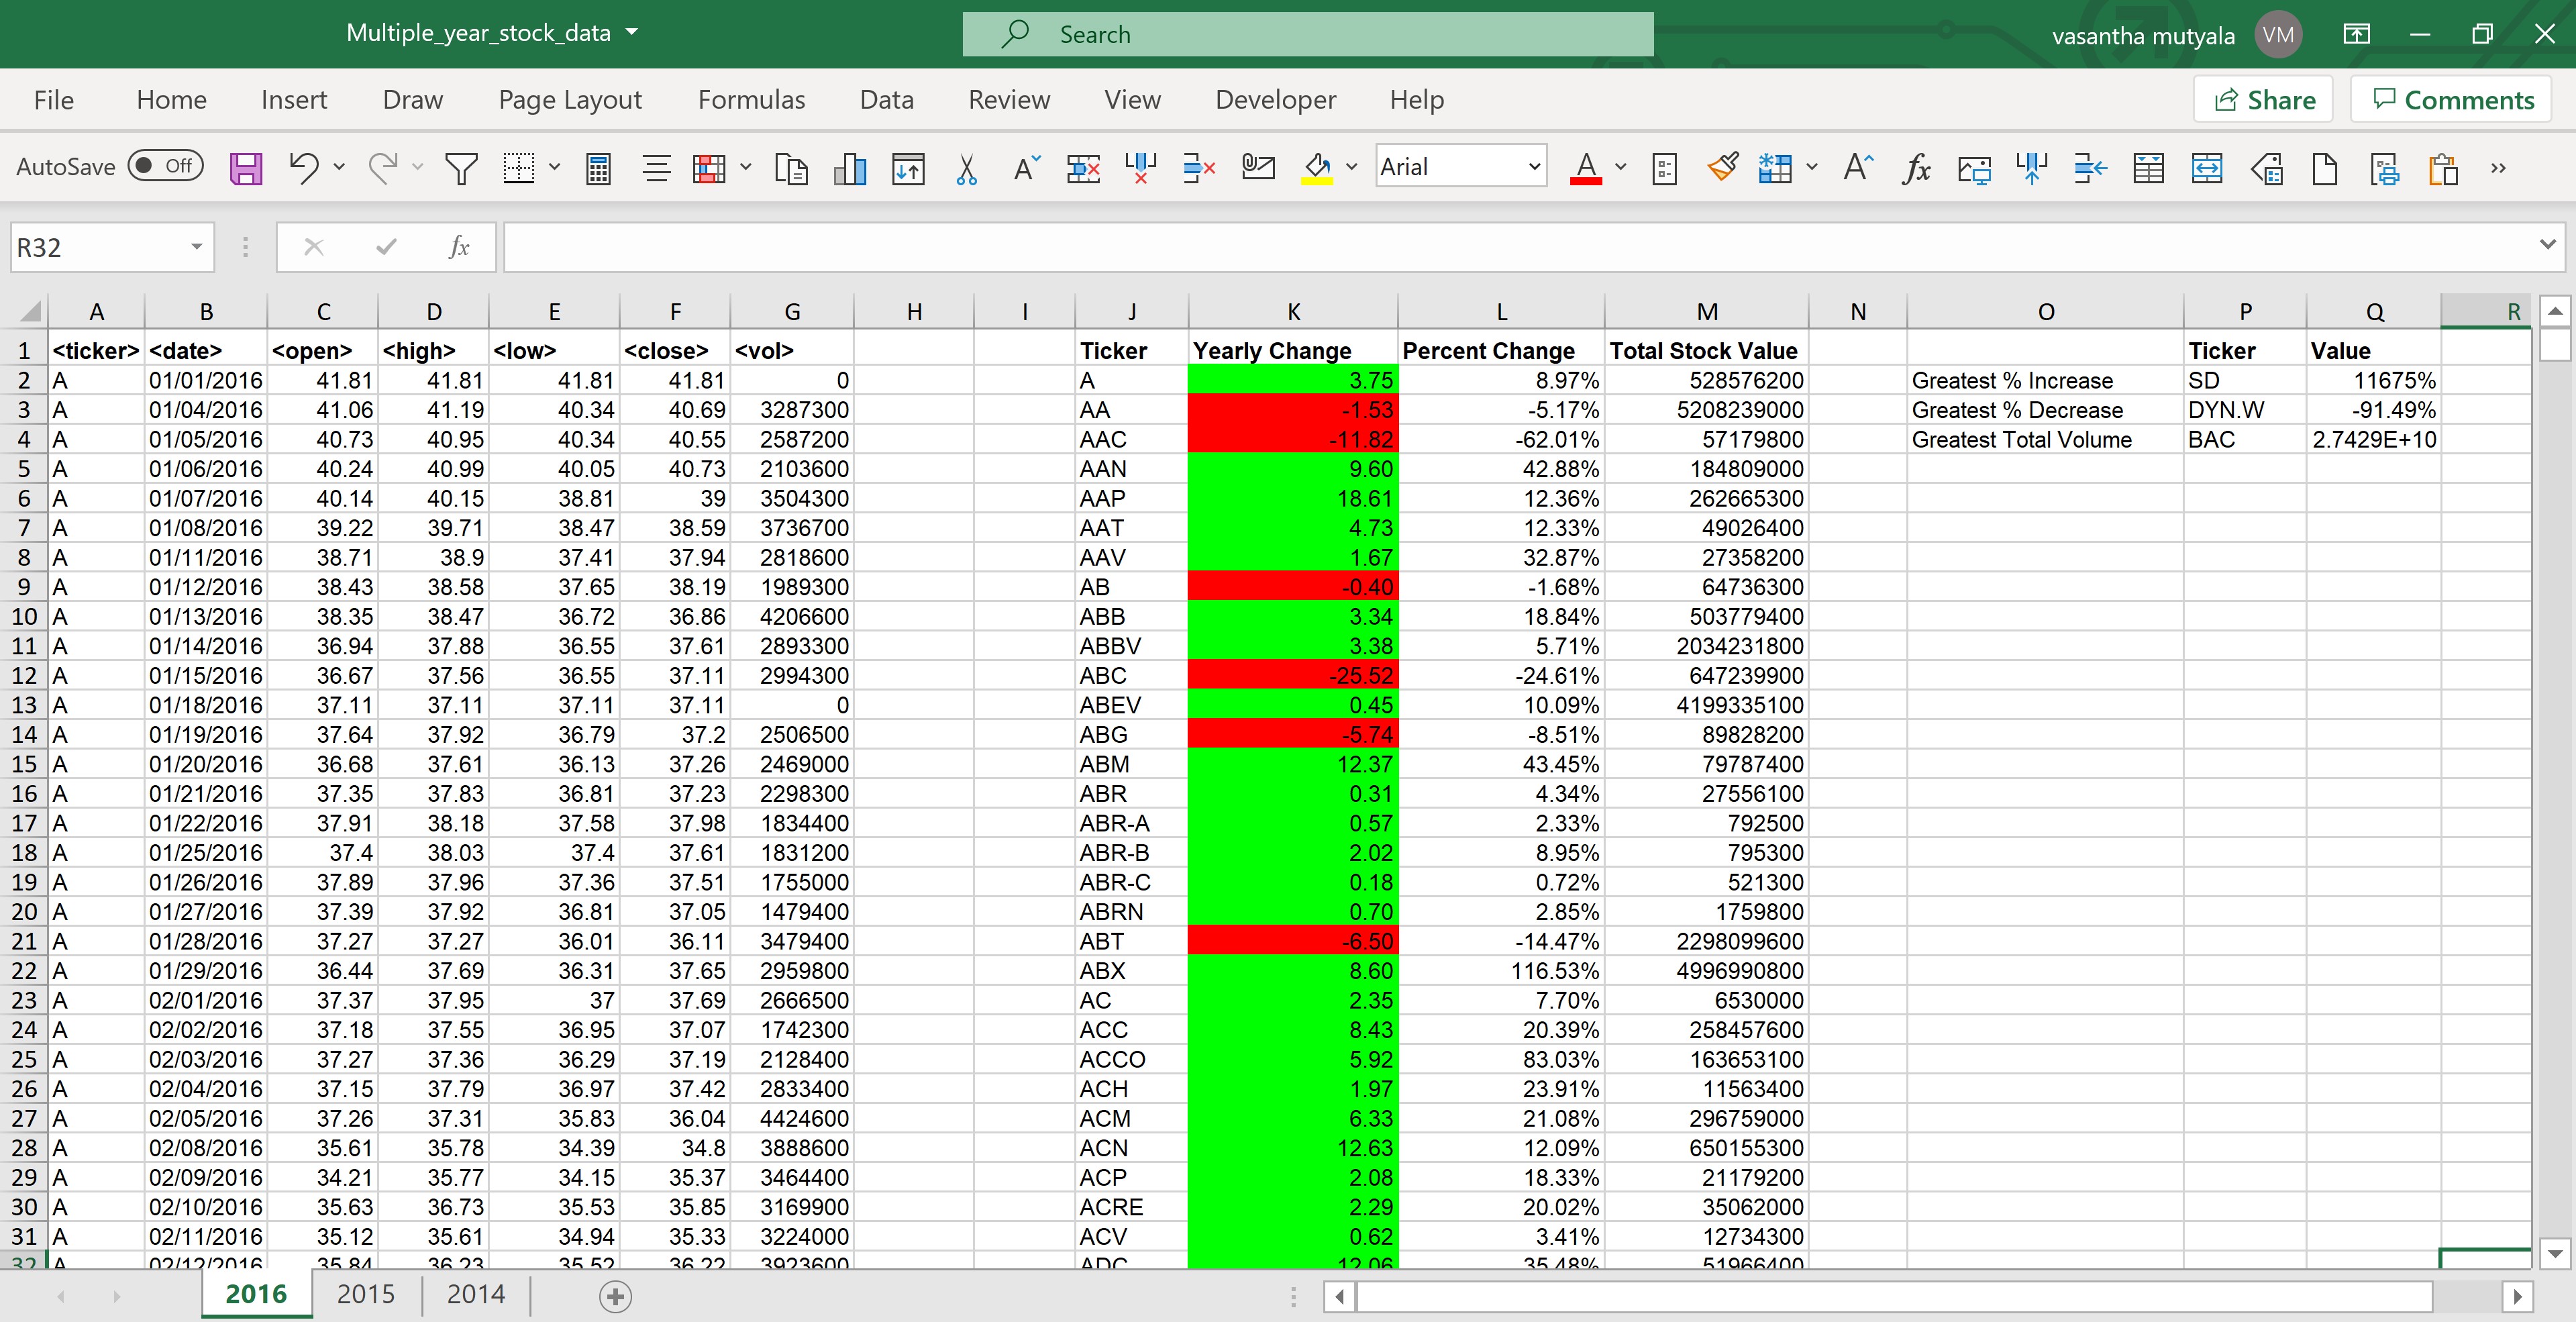
VBA Excel macro that reads excel workbook containing stock data, (each worksheet containing one year's data) and outputs the following information:
- The ticker symbol.
- Yearly change from opening price at the beginning of a given year to the closing price at the end of that year.
- The percent change from opening price at the beginning of a given year to the closing price at the end of that year.
- The total stock volume.
-
Conditional formatting that highlights positive change in green and negative change in red.
-
It also creates an additional summary table with the
- Greatest % increase
- Greatest % decrease
- Greatest total volume.
- Folder Multi_Year_Stock_Data_Screen_Shots : Folder contaning a screen shot for each year of results on the Multi Year Stock Data
- VBS file WS_Stock_Analysis_And_Report_Functions.vbs
- VBA Scripts
Sub Stock_Report_Main()
Call Format_Date_And_Sort
Call Generate_Summary
End Sub
This function formats the 'date' field to 'MM/DD/YYYY' and sorts the worksheet on 'ticker' and 'date' fields.
This function loops through the the worksheet, reads data from each row and generates summary table from the data.
-
The code is in the file
which can be located in files section.
-
Add the code to excel workbook by creating a module or by selecting 'Thisworkbook'.
-
Save and you will able to run the macro "Stock_Report_Main()".
- I tested the macro on "alphabetical_testing.xlsm".
- It took under 2 minutes to execute and show the results.
-
I have also tested the same macro on the "Multiple_year_stock_data.xlsm", and it executed in 8 mins.
- Most of the execution time was for date formatting. Once that has been formatted, the processing to generate the report was less than 2 minutes.
- I agree now that "Patience is Golden !"


- REST ASSURED, THEY HAVE BEEN HANDLED. Just Follow these detailed instructions ....